
2020 Predictions & Trends for Hamilton/Burlington Real Estate
Anyone else shocked that 2020 is already here?
A
new year & the start of a monumental decade!
If you’re anything like me, you’ll have some ideas of what the year ahead holds & if that includes real estate in Hamilton or Burlington, Ontario we’ve got some insights for you.
We’ll be covering things like…
▷Home Affordability
▷Economy Influences
▷2020 Predictions
▷Best & Worst Neighbourhoods in terms of Growth
Ok, ok, the thought of running through real estate stats has probably sent a few of you swiping away but I promise, in true genuine fashion, we’re keeping this as worthwhile as possible.
For a more entertaining way to consume… check out this week’s episode of the Genuine REALTOR® Show which covers everything you’ll read here with some flare!
Every year we attend the Canadian Mortgage & Housing Corporation’s annual 2020 Market Forecast hosted by the REALTROS® Association of Hamilton/Burlington. It gives a unique look at the year in review & forecasts trends for the year ahead… basically, it’s an amazing resource to help our clients navigate the market when buying or selling!
So, let’s jump in with the most problematic factor on the minds of many of our clients… affordability.
Here’s the good news, CMHC reports that 2019 saw very low unemployment rates in Hamilton which encouraged strong wage growth in the local economy — particularly in the manufacturing & some professional services sectors. This increase in the average wage was more than the increase in qualifying payments for mortgages — essentially how much more it costs each month for a mortgage on an average priced property.
The average individual’s wage has increased $165/month while the cost for an average detached home went up $135 per month in mortgage costs. For an average town, the cost went up $122/month & for an average apartment, the price to own went up $111/month in mortgage costs.

A driving factor in the increase in affordability was when the mortgage qualifying rate dropped last July which impacted the number of sales in the second half of 2019.
So, what exactly does home affordability look like for the average person?
Well, CMHC broke down the average income & the median sales price for cities in the immediate area to give us some perspective & their findings corroborate why we’ve seen people migrating west.
In Mississauga, for a family of 2 average earners, it would take 50% of their combined income to afford a detached home.
In Milton, you’d be looking at 45% of two average incomes to qualify.
Oakville is one of the highest at 65% of two average incomes to afford a detached home.
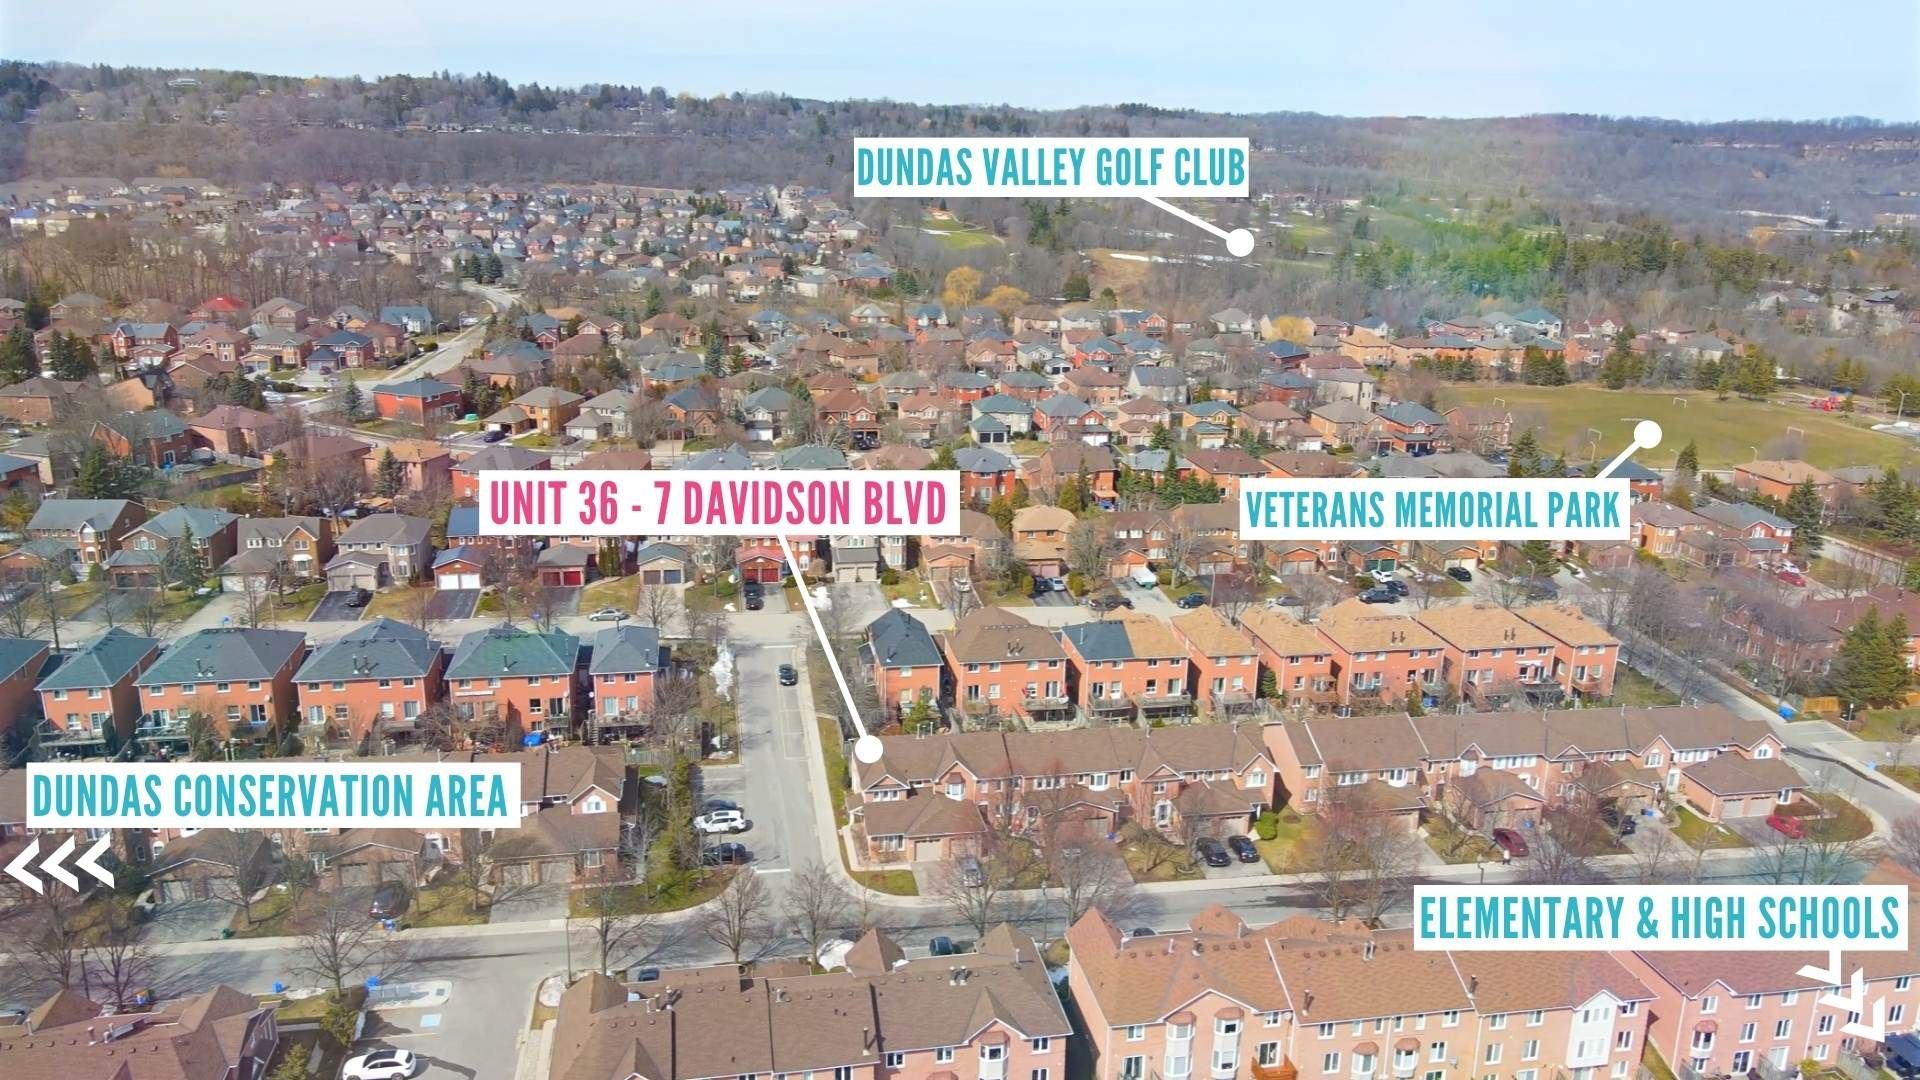
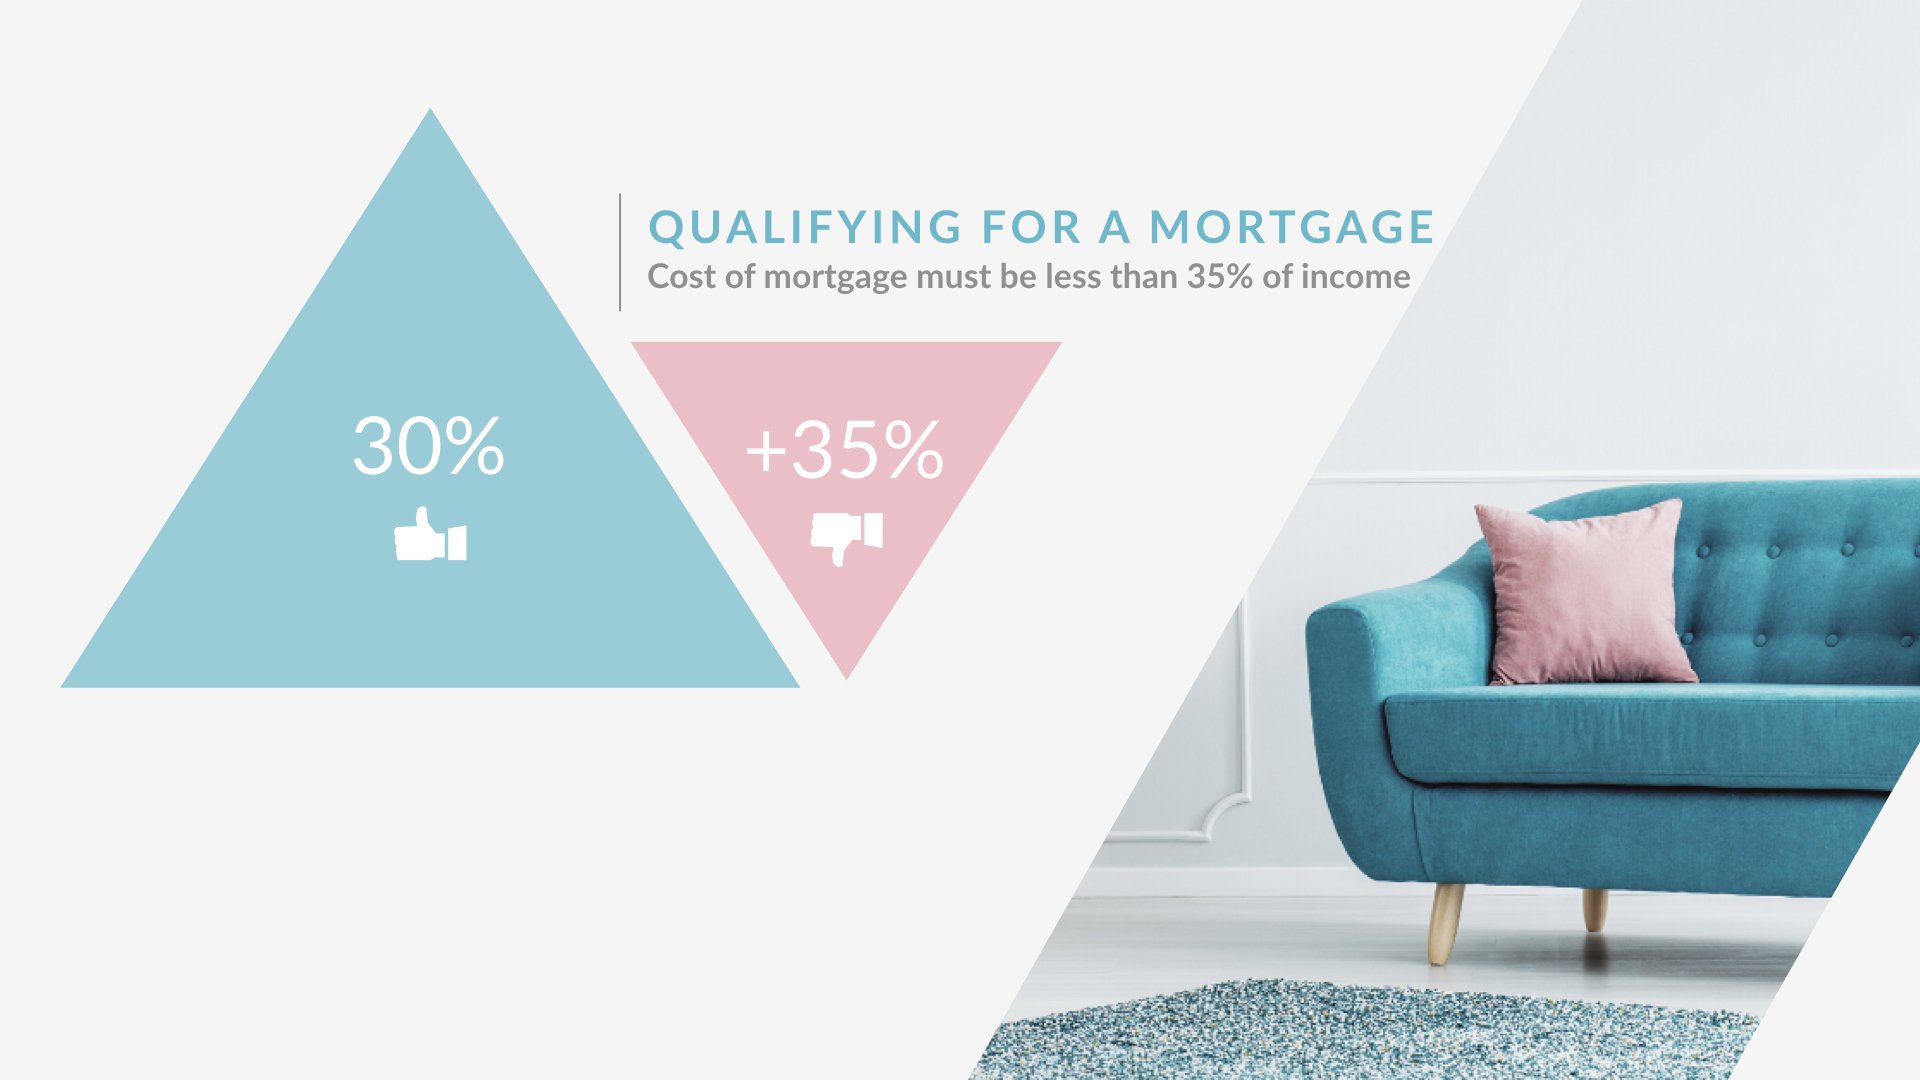
Hamilton & Burlington come in at a relatively affordable 30%.

For some perspective, qualifying for a mortgage falls around 30-35% of your monthly income. If the mortgage costs more than that, you’re not eligible for that price point. You can, however, compensate with a larger down payment, reducing any debt or getting more income on paper.
Now let’s take a look at which locations stood out in terms of growth…
For single detached homes, the top 3 for growth based on median sale prices were Hamilton Centre areas 21 & 20 as well as Hamilton East. These make sense as this is where the “affordable” homes are. These homes sell as there is a demand for the price point, I mean really, where else can you find a detached home for less than $400k… & the prices trend upwards because of it.

The Bottom 3 performers were Burlington 35 – which is Millcroft, Headon Forest, the Orchard, Corporate & Palmer…phew. It’s a big area! Followed by Dundas & Ancaster. The reason they didn’t see much growth in detached homes is because of the affordability limitations & low inventory, especially in Ancaster’s case.

Moving onto townhomes…
The Top 3 were Grimsby, Burlington 35 again & Hamilton Mountain. 50% of all townhomes sold last year were in the $350 – $500k range which is that hot pocket for affordability.

Because towns are such a sought after commodity, the top & bottom are a reflection of inventory rather than any one area outperforming another.
Grimsby’s geographical boundaries, being a relatively narrow strip of land between the shores of Lake Ontario & the escarpment, developers have focused on building high-density townhomes which helped boost affordability & number of sales.

The Bottom 3 were Ancaster, Glanbrook & Stoney Creek. Again, let’s note that all areas saw growth & the variance is mainly caused by the difference in inventory.
Last on the growth comparisons are apartment-style condos… 90% of those sold were less than $500k which makes this the most sought after style, again due to affordability.
 The Top 3 areas for median growth were Hamilton Centre, Hamilton East & Hamilton West. Hamilton Centre saw such dramatic growth because of the development projects & an increase in new builds. If we isolate just the resale units, we’re still looking at 15% growth!
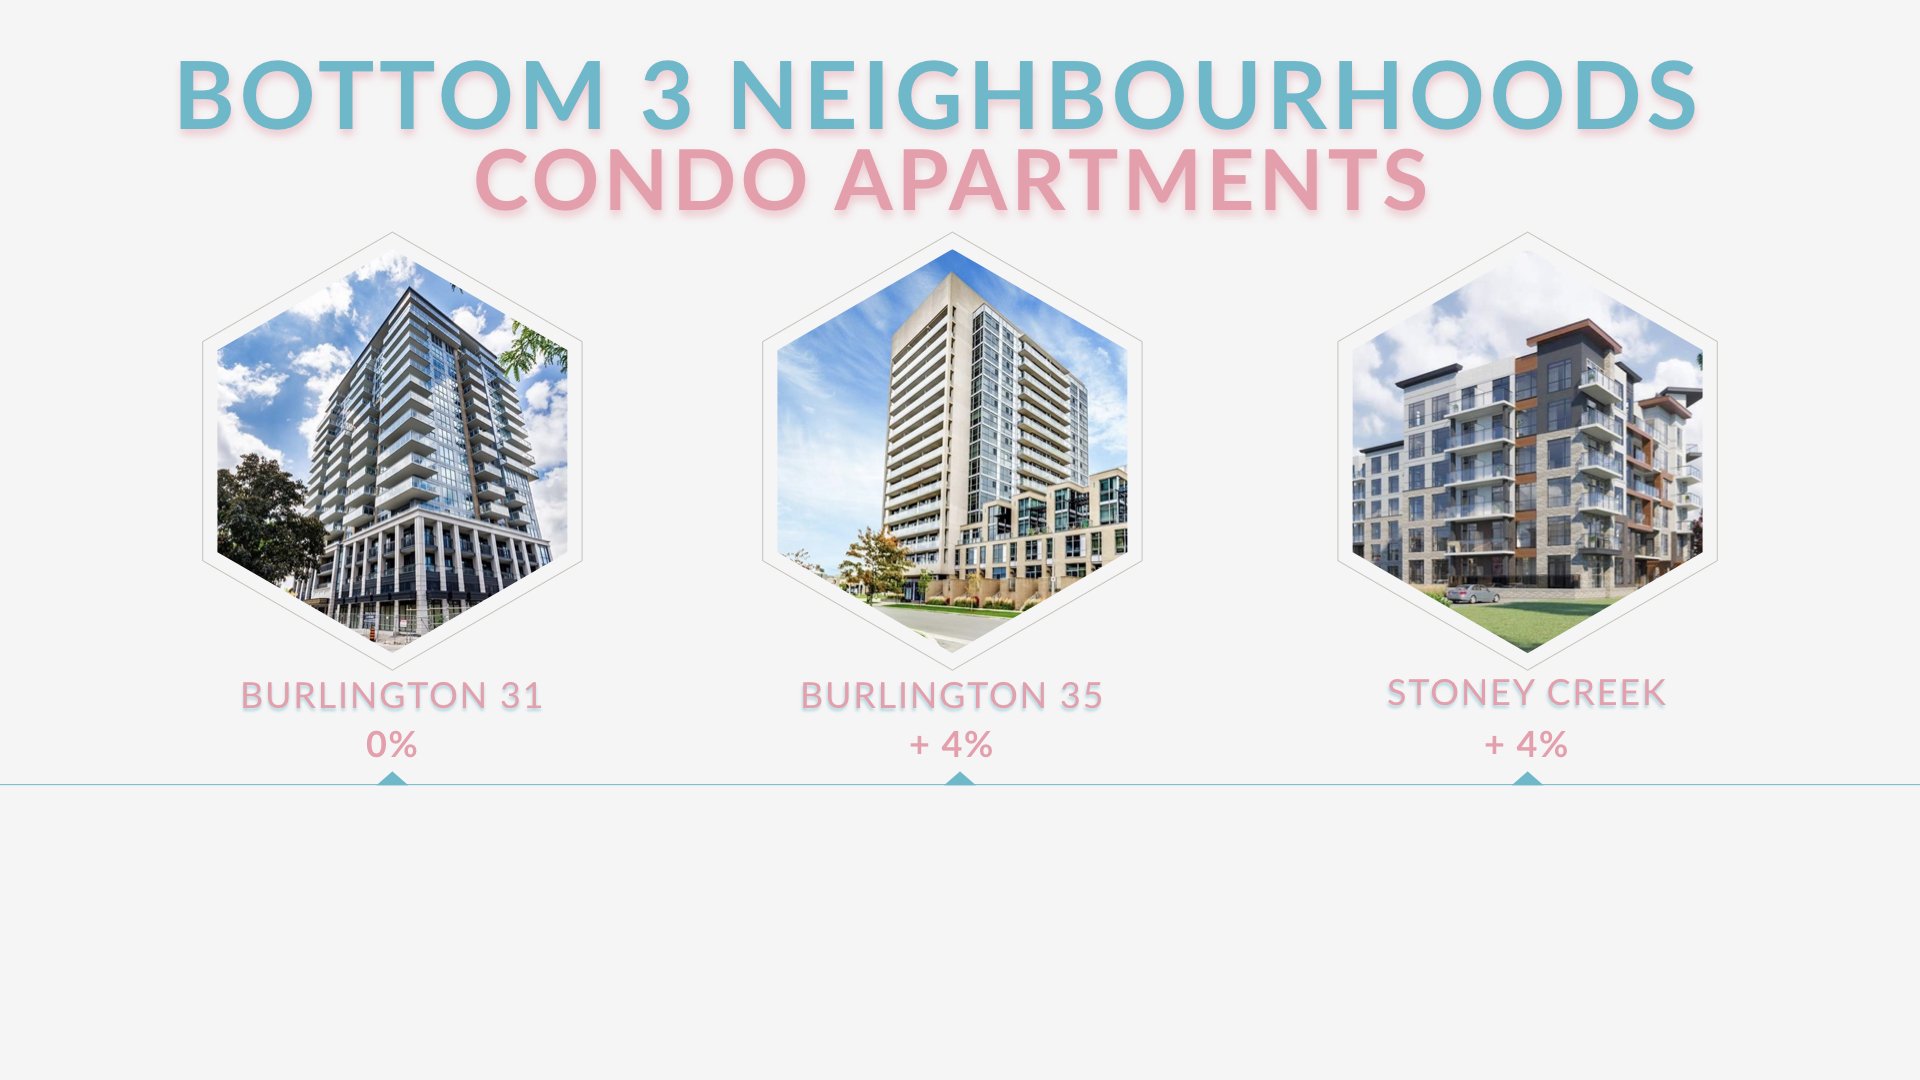
The Bottom 3 were Burlington 31, which is the downtown core, so Maple & Plains areas… Followed by Burlington 35 again & Stoney Creek.
For Burlington’s downtown, inventory & price point play a big role in the lackluster growth. The area itself is highly sought after but not accessible to everyone who wants to own a condo due to affordability.
So what’s on the horizon as we jump into a new decade?
CMHC has looked at the numbers & is predicting that the number of sales will be stable or higher than 2019 where we saw around 12,900 sales in Hamilton/Burlington.
There is nothing to suggest a slowdown in economic growth so we can expect stable employment & wages.
There are also no indicators of mortgage rates going up which is great for buying power but it’s looking like wages will keep pace with the cost of mortgages, so it’s unlikely we will see any further narrowing of the affordability gap in 2020.
We can expect to see an overall growth in Hamilton/Burlington of somewhere between 5 – 7% & after attending their market forecasts for a few years, CMHC regularly hit their predictions.

So the big takeaway from all of this is, if you’re a first time Buyer, the market is not going to become any more affordable. If you’ve been saving for a home but can only afford a condo, you’d likely be better off getting onto the property ladder now & leveraging that first purchase to get into the home you’re dreaming of.
If you’re looking to sell & your property is in the $400 – $700k range, you’re in the high demand price point & should be able to maximize your return with the right marketing plan.
Whatever your situation, we would love to sit down with you & discuss your options!

Keeping it Genuine,
Rochelle Edwards
The Genuine REALTOR®
* All statistics, figures & predictions are those of CMHC Statistical Analysis
The Genuine Blog